
Live
See your whole system at a glance
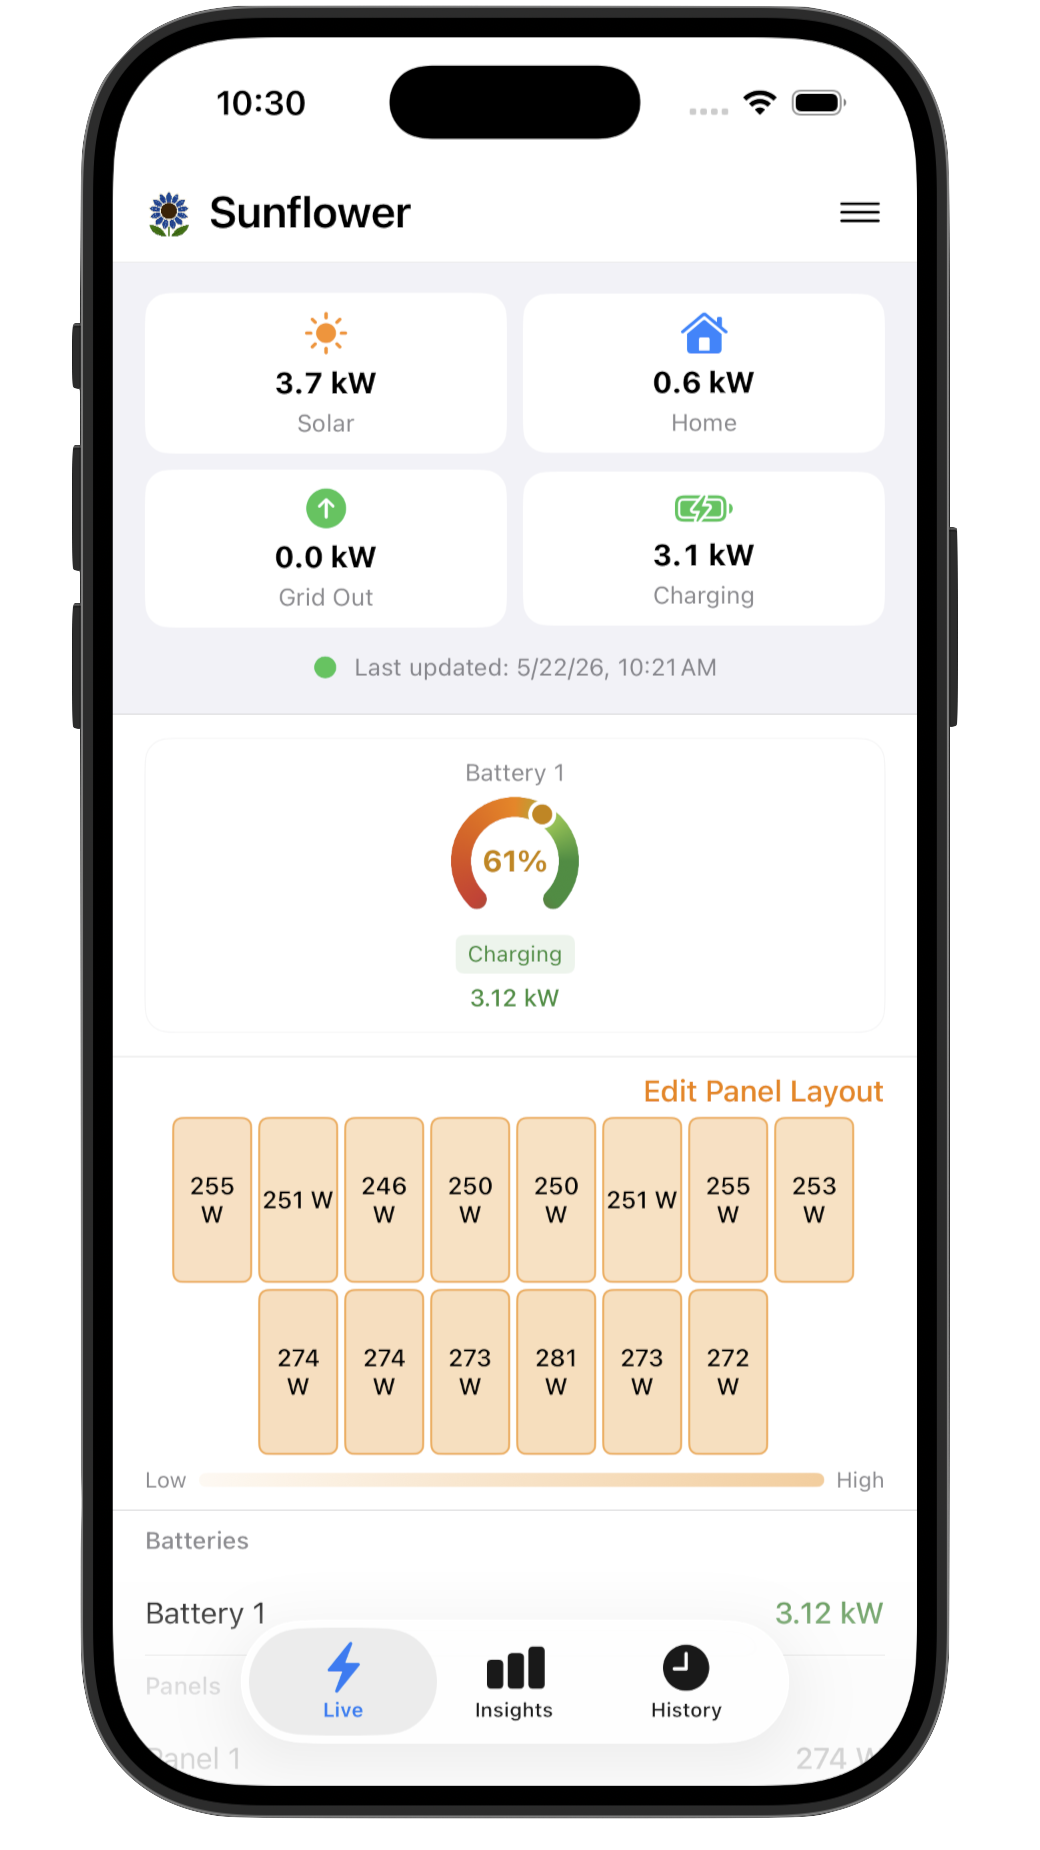
Customizable overview tiles show solar production, home consumption, grid import/export, and battery charge. A panel layout map highlights any underperformers in real time.
A live view of every panel and battery in your SunPower system — current output, charge state, energy flow — all from your phone.
Built for SunPower · Requires PVS5 or PVS6
Free to try
Frustrated with the SunStrong Connect App? The alternative to the $99/year SunPower app transition. See how Sunflower compares →
Navigate three focused tabs to go from real-time status to deep historical analysis in seconds.
Customizable overview tiles show solar production, home consumption, grid import/export, and battery charge. A panel layout map highlights any underperformers in real time.
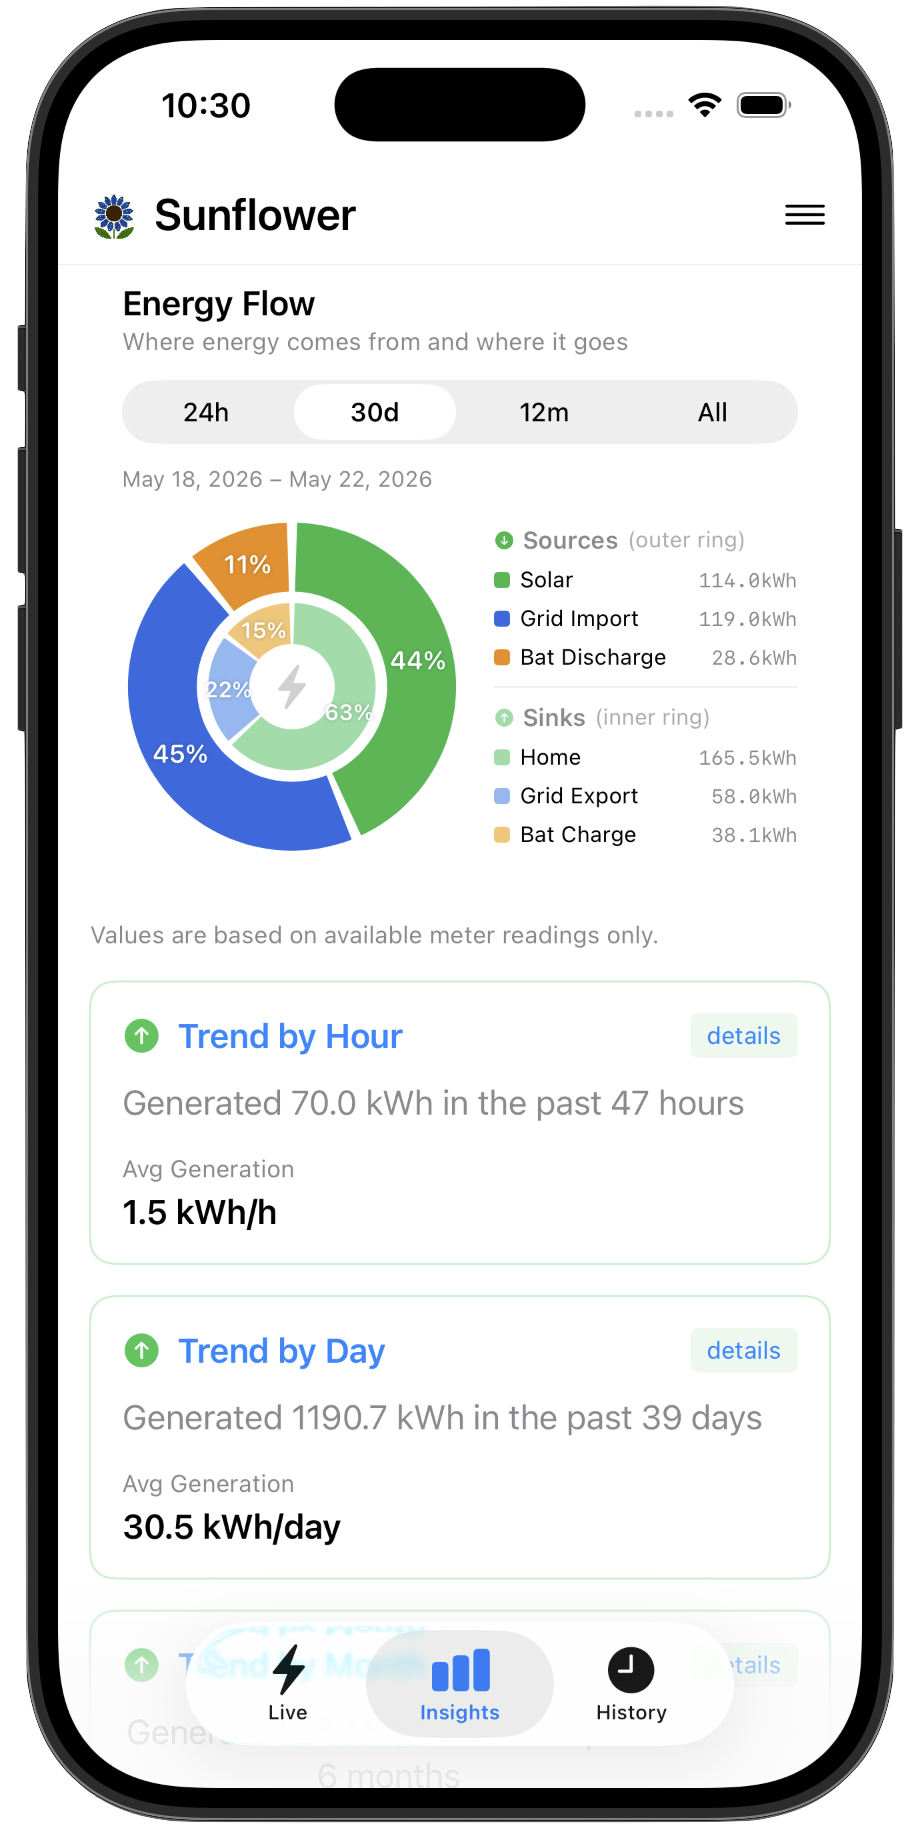
An energy flow breakdown shows how solar, grid, and battery contribute to your home across the last 24 hours, 30 days, 12 months, or all time.
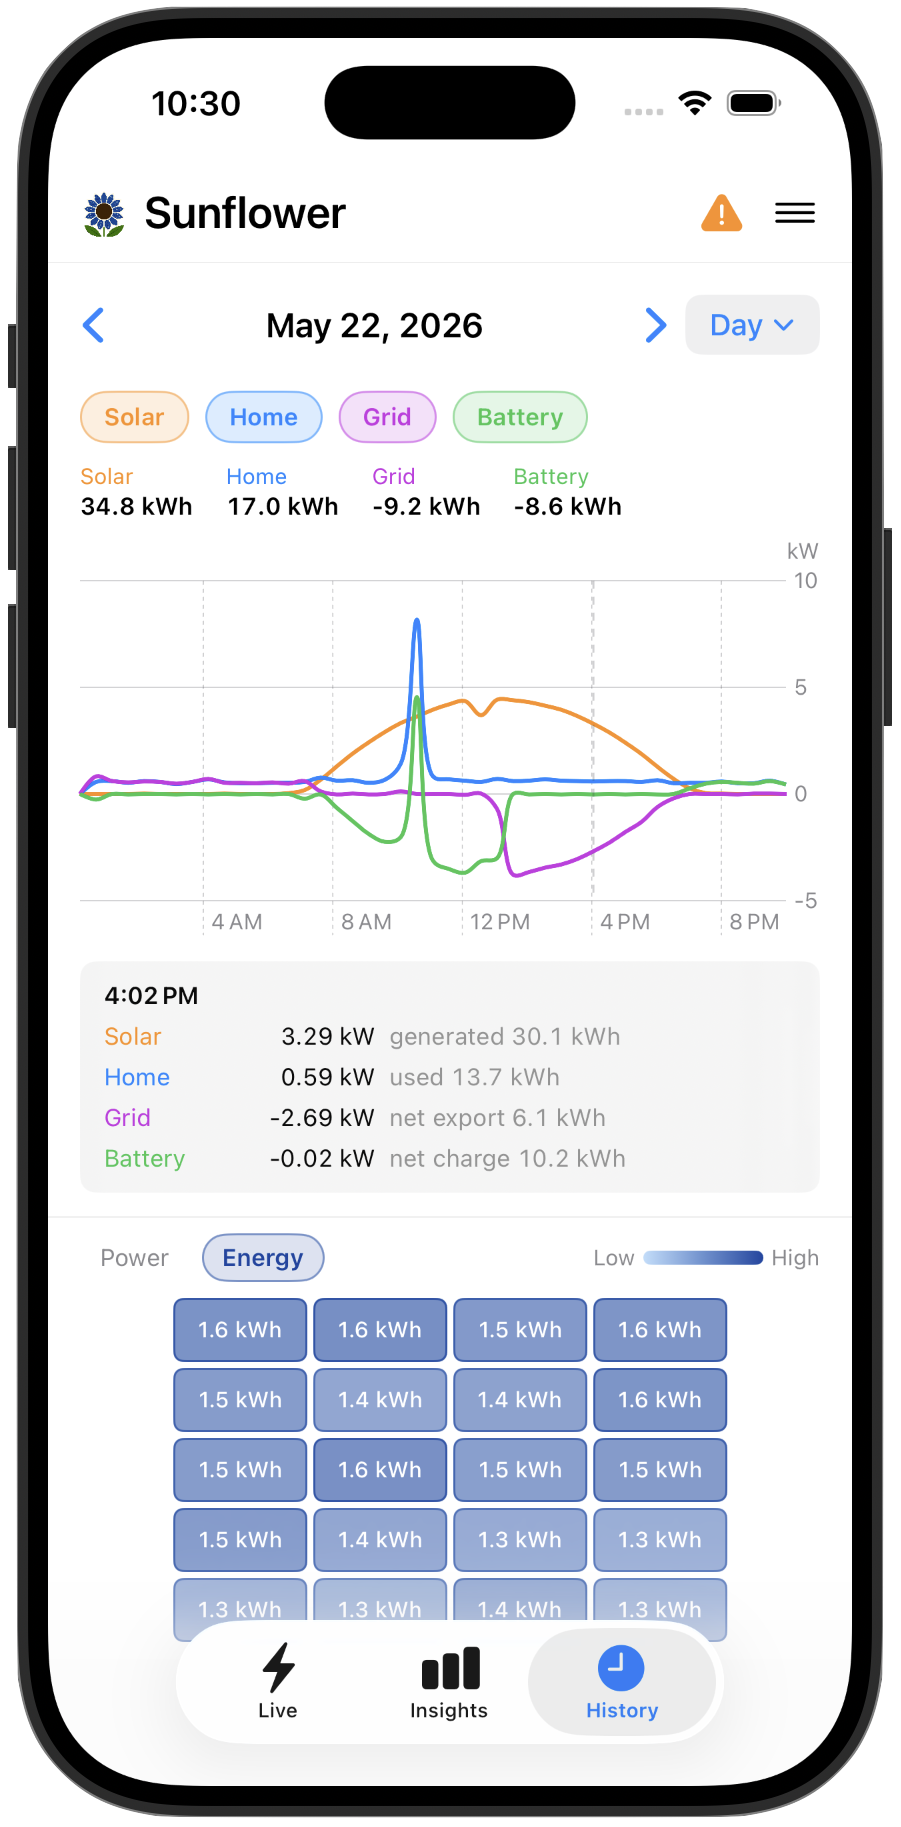
Day, month, and year views with individual panel-by-panel breakdowns. See exactly which panels produced what and track trends over time.
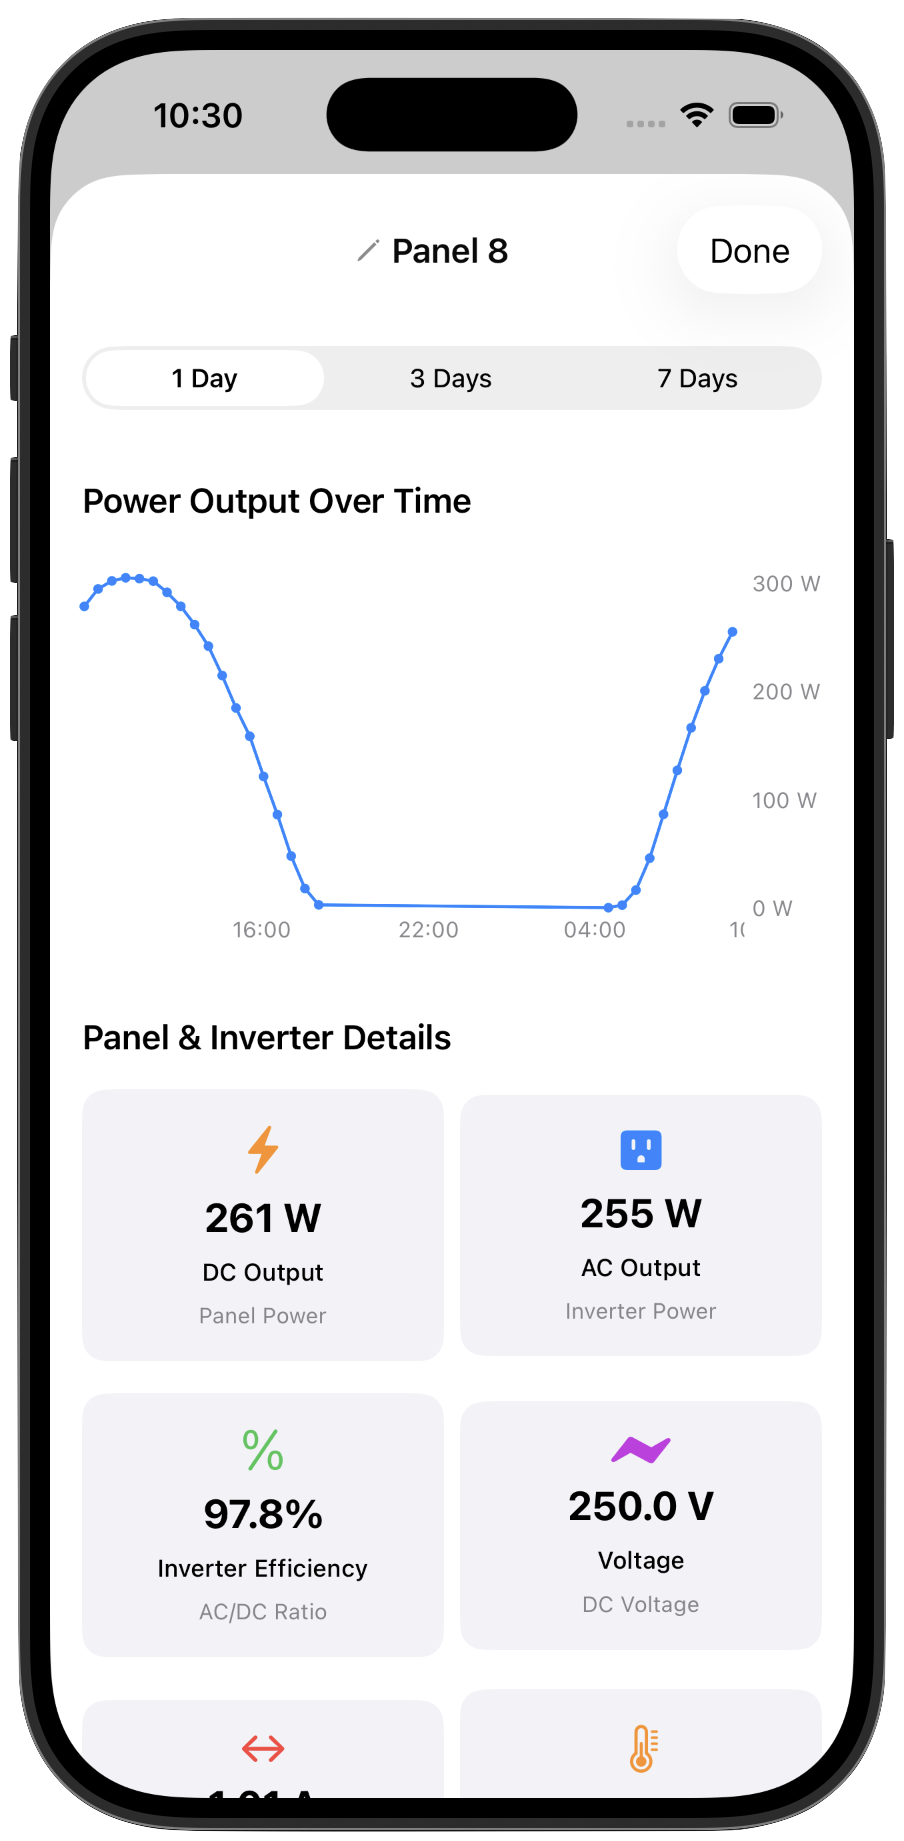
Tap any panel or battery for a full detail view — power output over time, DC/AC output, inverter efficiency, voltage, and historical charts at 1-day, 3-day, and 7-day resolution.
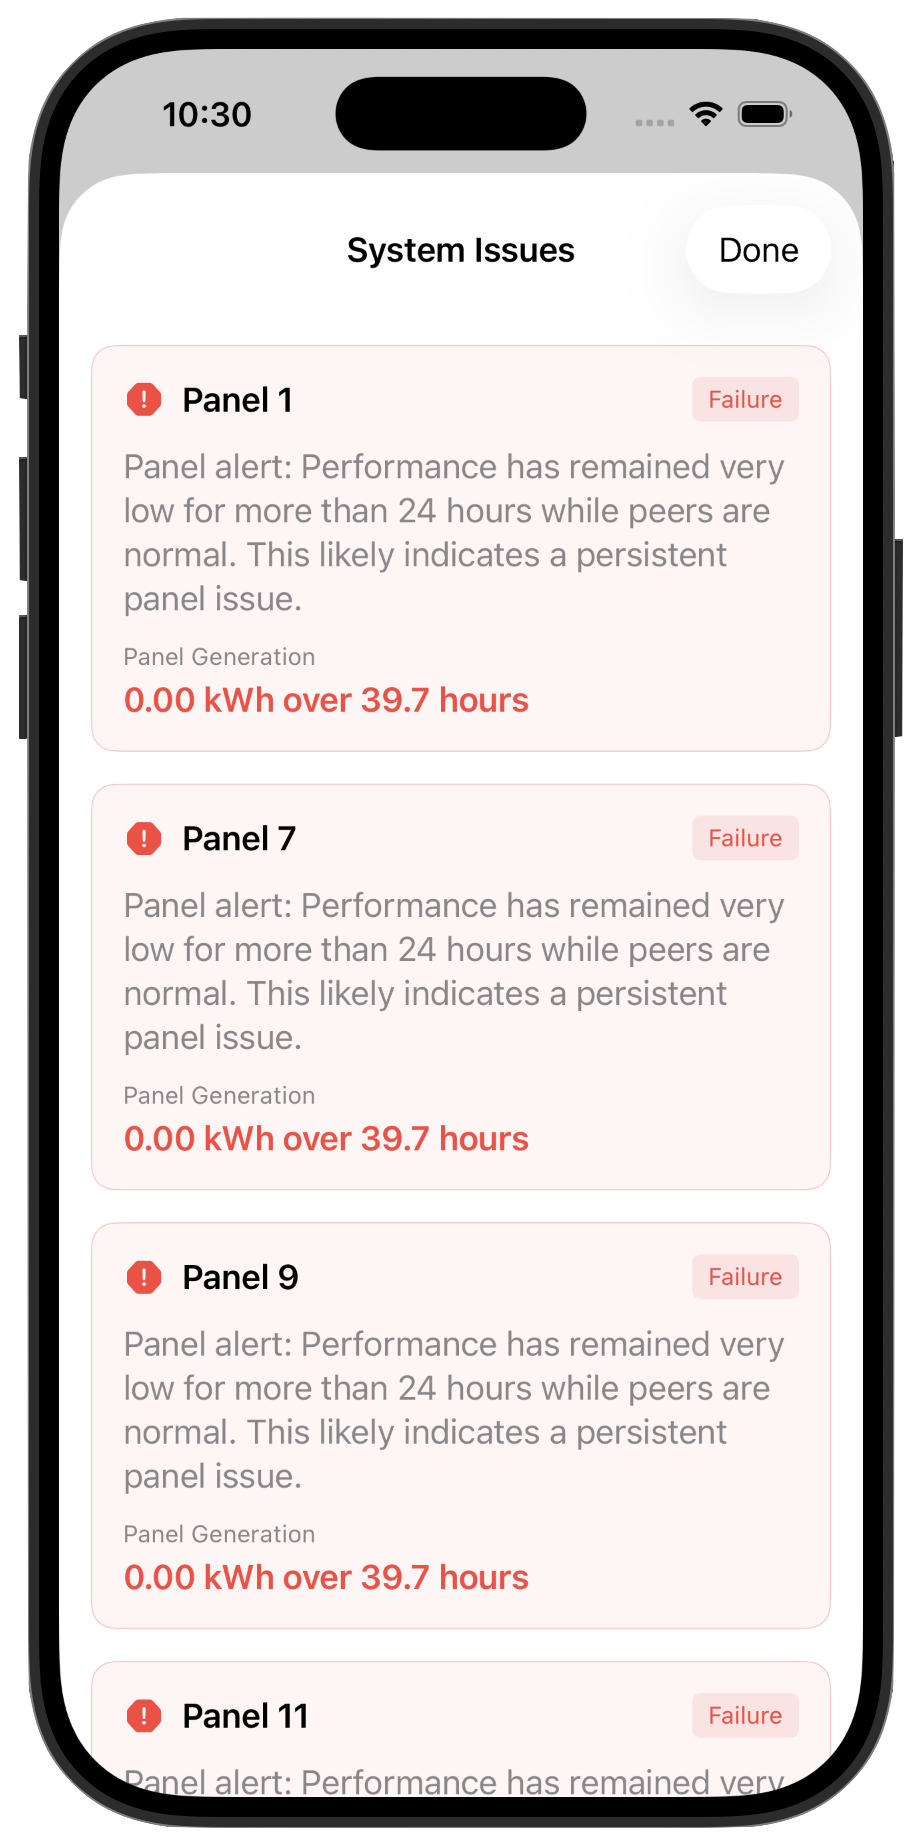
Sunflower watches your panels continuously and flags underperformers.
Want access to your data from anywhere — not just when you're on the same Wi-Fi? The optional Sunflower Bridge simply plugs into your wall outlet and delivers 30-minute interval readings to the cloud, unlocking full History charts from any network, anywhere in the world.

Free to try. Works out of the box. Available for iPhone and Android.